NASA GISS Temp Data Changing?!?
Update: Not that anybody read my original post below, but this is a significant update.Dr. Sato replied quickly to my email regarding the data change. He explained that Australia and Antartica did not report their temperature data for August when the 0.43C figure was posted. Now that they have, it increased the global temperature significantionly. His explanation is plausable and I take him at his word.
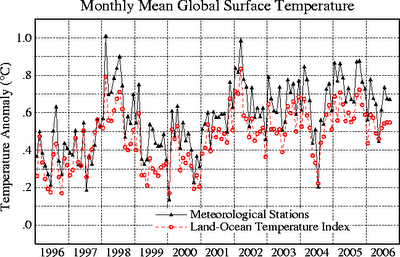
I posted here about how Global Warming science is reported in the newspaper versus the scientific journals. In that post, I noted that Aug-06 was the coolest August since 1997 and linked to NASA's Goddard Institute for Space Studies web page where they report the global average temperature variation. That link is here. If you follow the link, you will think Jim VAT is on drugs because Aug-06's data shows a 0.67 C variation from the mean temperature of 14.40 C which is not the lowest since 1997. And yet, until today (13-Oct-2006), the data table read 0.43C variation from the mean. Not only had Aug-06's data changed, but so did Jul-06 (from 0.78C down to 0.74C). In fact, when I logged on today to check the table, the table had already changed, but the graphics had NOT! Noticing something was amiss, I started downloading the graphics before they changed as well. Here is the before:

Here is the after:

Notice the after picture does not have the dip down to 0.43 and now shows the revised Aug-06 as well as the new Sept-06 data point.
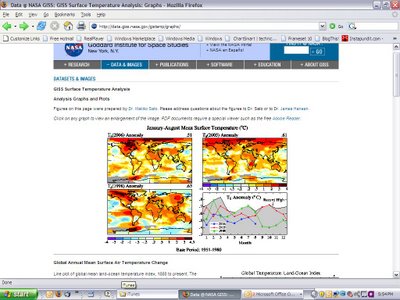
I was unable to get any screen shots other than this:

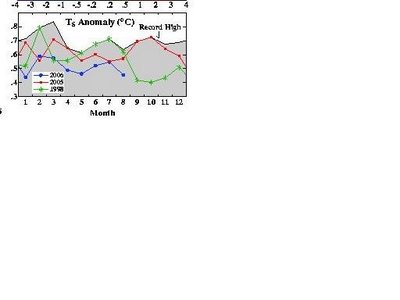
Of the four charts above, the one in the lower left plots the 2006 data in the blue line. Here it is zoomed in:

Here is how it looks now:

Notice the change in the Aug-06 data point from 0.46 to 0.55 (this is the Land+Ocean Data - the 0.43 and 0.67 is from the Station data set). All the data tables changed, then the graphics started changing.
I have emailed Dr. Sato of GISS for an explanation and will revert here if I get a plausible reason why the data changed today.

0 Comments:
Post a Comment
<< Home